Do you use The Visualization Universe?
What is The Visualization Universe?
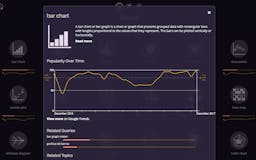
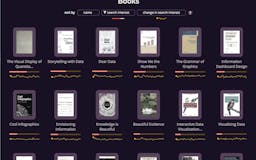
All chart types and tools in a single visualization ranked by popularity and rise in popularity. This catalogue explains the meaning of each chart and the tools that make them. You can use it to look up their meaning when you visualize your data or stories. Search interest data is updated daily.


Recent launches
Charts
Explore this interactive visualization about the world of visualization itself - see charts arranged by popularity and trends in this collaboration between Google ...

The Visualization Universe
All chart types and tools in a single visualization ranked by popularity and rise in popularity. This catalogue explains the meaning of each chart and the tools that make them. You can use it to look up their meaning when you visualize your data or stories.
Search interest data is updated daily.
