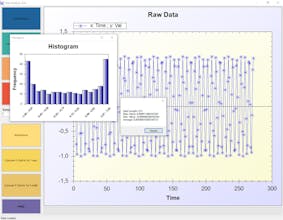
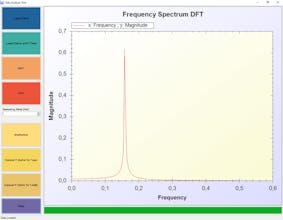
This tool is for 2D measurement data or data prepared with 2 columns. After loading the * .xlsx file you record or prepared with 2 columns, you can examine your data graphically. You can save graphs as image file.
Data analysis can give frequency spectrum of second column by clicking “DFT” (discrete Fourier transform) or “FFT” (fast fourier transform). Sampling rate input belogs to this transforms. By clicking “Statistics” button you can get histogram, polynomial least squares equation and other info of second column.
This tool also saves loaded data as *.csv or *.mdb file for further data processing.
youtube.com/watch?v=_a9Z2ORHyMc


